Supercomputers are becoming more and more involved in the study of complex physical systems. It is not rare that the supercomputers receive more than \(10^5\) jobs (i.e. an execution of a program on a predetermined number of CPUs for a certain time) during a year.
In order to improve the machine functioning or to educate the users about good practices, some metrics and automatic analysis tools are needed. In this post, we present the first results of seed, a tool designed to extract some characteristics of the usage of the supercomputer and present to the users good practices.
As an example of application, we take the jobs submitted on Kraken, the supercomputer of CERFACS, from 2019 to 2022. For the specialists of Kraken, only the queues ‘debug’, ‘prod’, ‘weekend’ and ‘icelake’ are considered.
Frequentation of the supercomputer
One of the most basics study that we can perform on a supercomputer is to look at the frequentation of the supercomputer.
For example, we can look at the moment of the day, of the week or of the year, where the users submit their jobs. For Kraken, along the years, this gives:
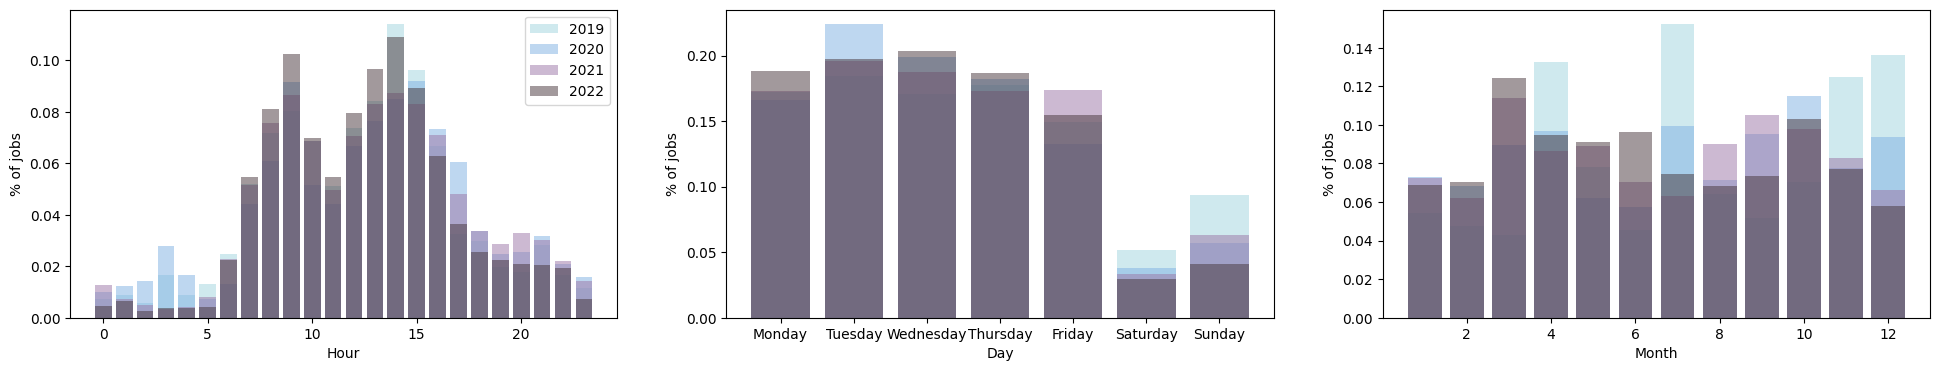
Surprisingly enough, the users submit more jobs when … they work (crazy, right ?). Thus, you can observe that less jobs are submitted at night, at lunchtime, and during the weekend. This behaviour is reproducible along the years.
Another thing we can look at is the number of active users each week of the year. For Kraken:
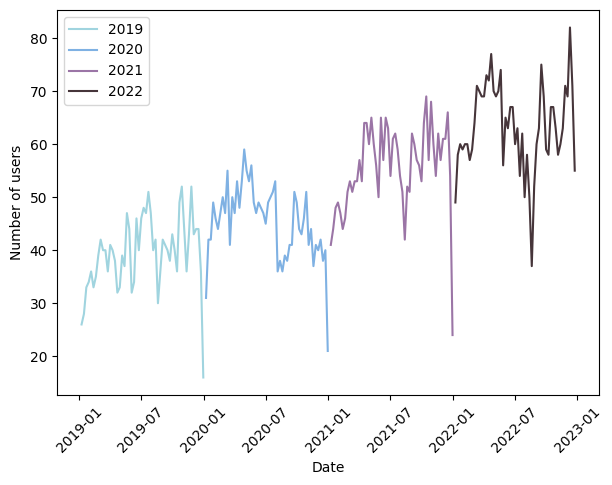
The number of active users on Kraken globablly increased every year. We can still observe that there are less active users during the Summer and Christmas holydays. Strange, isn’t it ?
Finally, with seed, we can also observe the occupation and allocation requests on the supercomputer. Below, the percentage of cores hours and allocation of cores hours compared to the maximum capacity of Kraken:
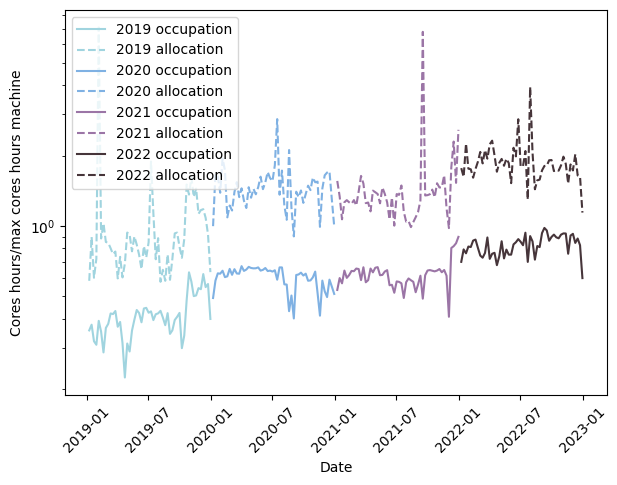
Again, note the increase of the occupation and allocation on Kraken through the years. Sometimes, the allocation can even be 8 times the machine capacity. We also observe on the 2022 period, a global occupation on the queues debug, prod, weekend and icelake of 80%. A VERIFIER.
Jobs characteristics
So, we have now a general point of view of the machine usage. But, we can go further and extract some statistics on the jobs characteristics that the supercomputer receives. For example, we can represent the duration of the jobs:
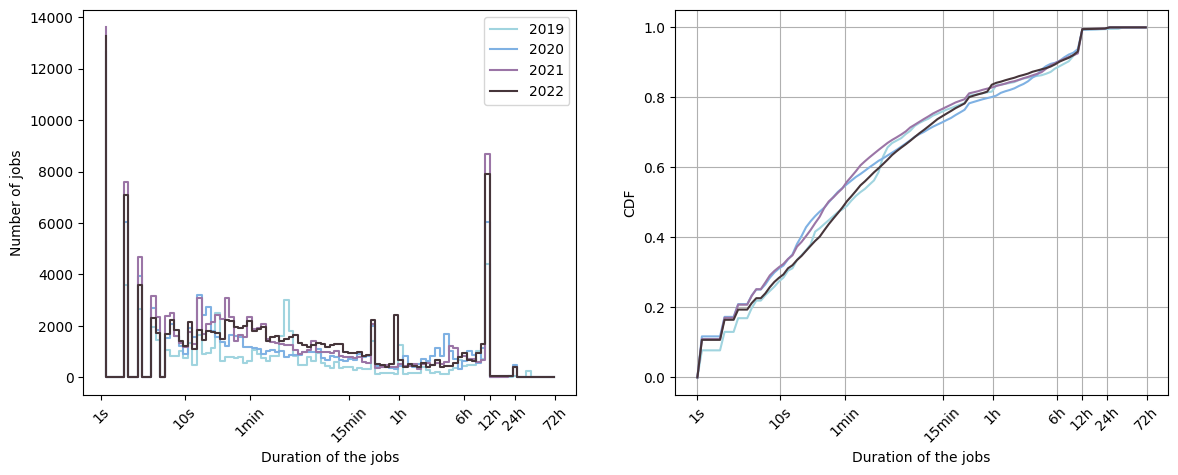
On the left is plotted the histogram of the number of jobs as a function of the duration of the jobs. On the right is depicted the corresponding Cumulative Distribution Function
that quantifies the probability of the random variable \(X\) being inferior or equal to \(x\).
We can observe that many jobs (approximately \(10\%\) of the jobs) last less than 1 second. They probably correspond to simulations that crashed. Many jobs also last 12h corresponding to the timelimit of the queue prod. Thus, many users send their job until being kicked out by the scheduler of the supercomputer.
Another quantity that we can look at is the number of cores allocated to the jobs:
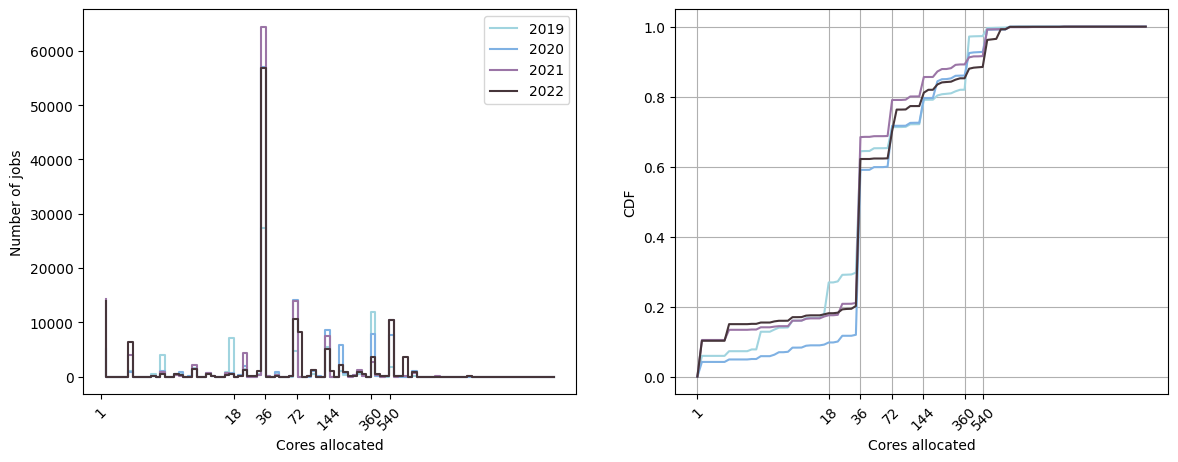
On Kraken, approximately \(40\%\) of the jobs run with 36 or 38 cores, corresponding to using one full node on the queues considered. A considerable number of jobs also run with only one core, probably many small parallel jobs with different parameters. Finally, the other most favorite number of cores used are around 72, 144, 360 and 540, corresponding to respectively 2, 4, 10 and 15 nodes.
Finally, following the two last graphs, we can plot the distribution of the cores hours of the jobs:
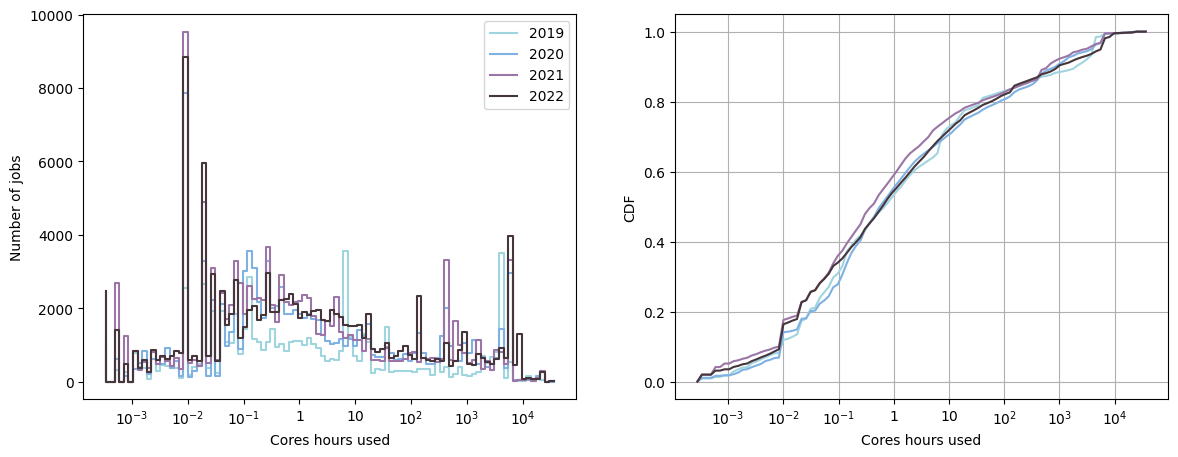
On Kraken, many jobs uses less than 0.1 cores hours. These jobs are the programs that crashed. We can also observe on the CDF, that approximately \(60 \%\) of the jobs allocates less than 1 core hour.
Waiting time
All these jobs characteristics are interesting for the curious people and to have a better insight on the usage of the supercomputer. However, the users are rarely interested in this kind of statistics. Their jobs must have a certain number of cores to run optimally and must last until generally a fluid condition is reached. How much time does the user have to wait before his job can start ?
Below, you can check out the distribution of the waiting time on Kraken:
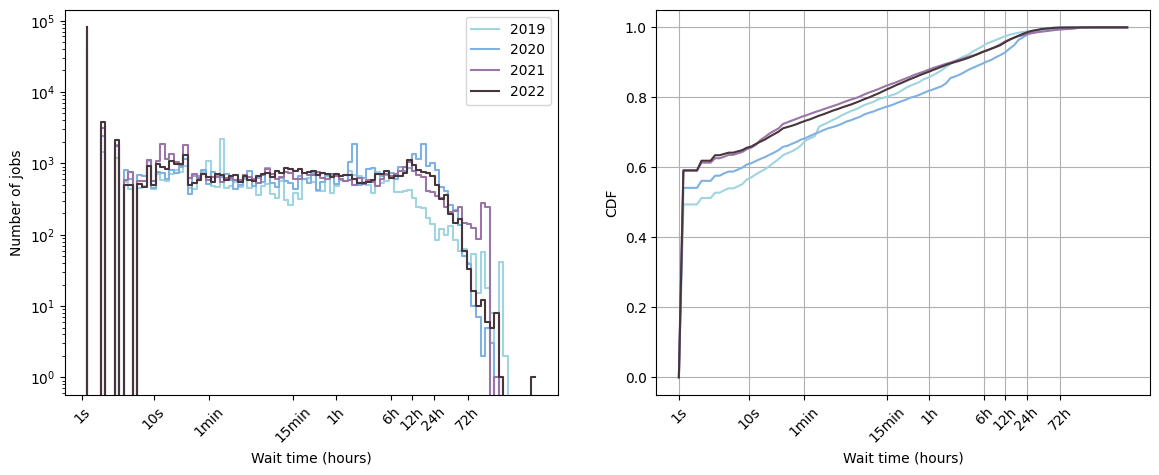
Note that in 2021 and 2022, \(60 \%\) of the jobs started immediately and \(80 \%\) of the jobs before 15 minutes.
We can also separate the queue debug from the other queues since these jobs on the queue debug are much shorter. The waiting time as a function of the date, separating the queue debug from the other queues is given by:
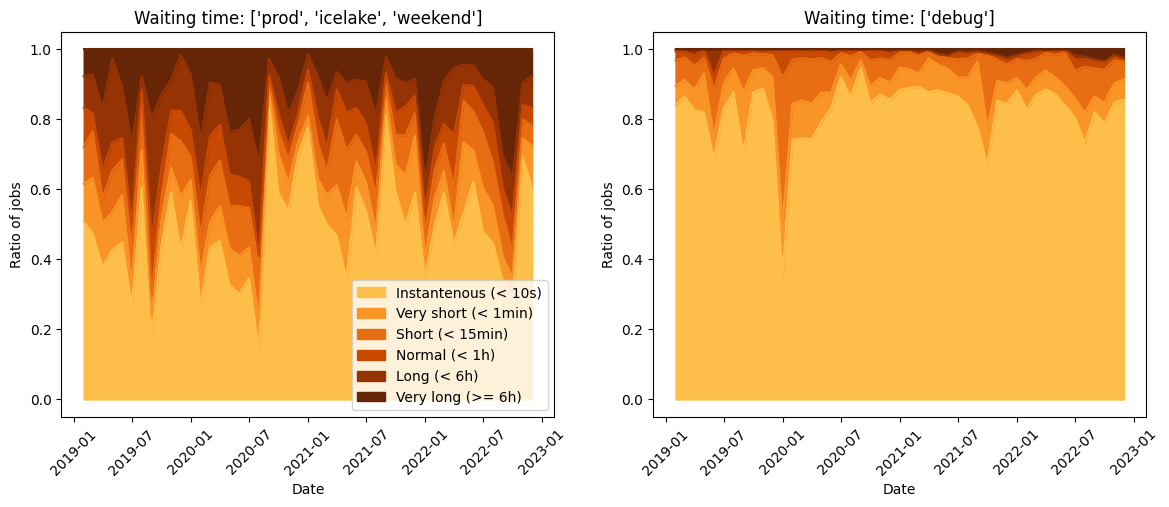
More than \(90 \%\) of the jobs start before 15 minutes on the queue debug. Obviously, the waiting time on the others queues is longer since the jobs generally last more time on these queues.
Accuracy of the user
Waiting that a job starts running is probably the most frustrating thing for the user (especially if the job crashes almost immediatly after waiting 1 day or more: argggghhhhh!). In order to reduce the waiting time, two realistic strategies exist:
- change the timelimit or maximum number of nodes of the queue. These parameters exclusively depend on the HPC administrators. Thus, the user has generally no power on this, and even for the HPC administrators, this can be a headache to find the optimal parameters.
- educate the users on better tailoring the jobs. On this, you (yes, you !) have the power. And as someone wised once said: “with great power comes great responsabilities”.
Indeed, it is not always possible or even desirable to change the number of cores or duration of the simulation. However, it is possible to make an effort on the time limit set to the job. We already streched the importance of a well calibrated time limit in this post.
We call the wall clock time accuracy the ratio between the duration of the job and the time limit set by the user. Below is represented the distribution of this wall clock time accuracy on Kraken:
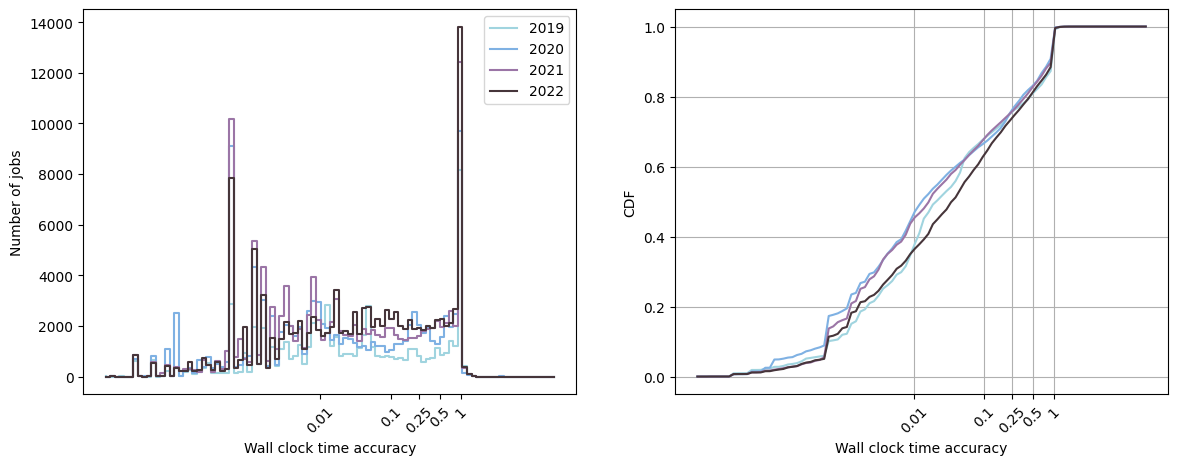
Note that approximately \(80 \%\) of the jobs have a wall clock time accuracy inferior or equal to 0.5. In other words, the duration of these jobs is half the time limit set by the user. This is bad practice as this disrupts the backfilling mechanism of the scheduler (again check this post for more information on the backfilling).
On the other hand, approximately \(10 \%\) of the jobs stay until being kicked out by the scheduler (wall clock time accuracy = 1). If the program ended exactly at the time limit (the probability of that is extremly low), then all good ! However, generally, that means that the stopping condition of the job was not reached before the time limit. A new job must then be run from the last saved solution. If the last saved solution was not just before the time limit, computational resources were wasted from the last saved solution to the time limit. If we estimate the percentage of time wasted by each job to \(5 \%\) (36 minutes when the time limit is 12 hours), then for Kraken, the number of hours and days wasted by the users are:
| Years | 2019 | 2020 | 2021 | 2022 | Total |
|---|---|---|---|---|---|
| Hours machine not used | 63 | 86 | 71 | 66 | 287 |
| Days machine not used | 2.5 | 3.5 | 3 | 3 | 12 |
This corresponds to almost 3 days a year where the Kraken supercomputer can not be used.
Finally, we can also plot the accuracy as a function of the date to check more in details the evolution of the users habits regarding the time limit:
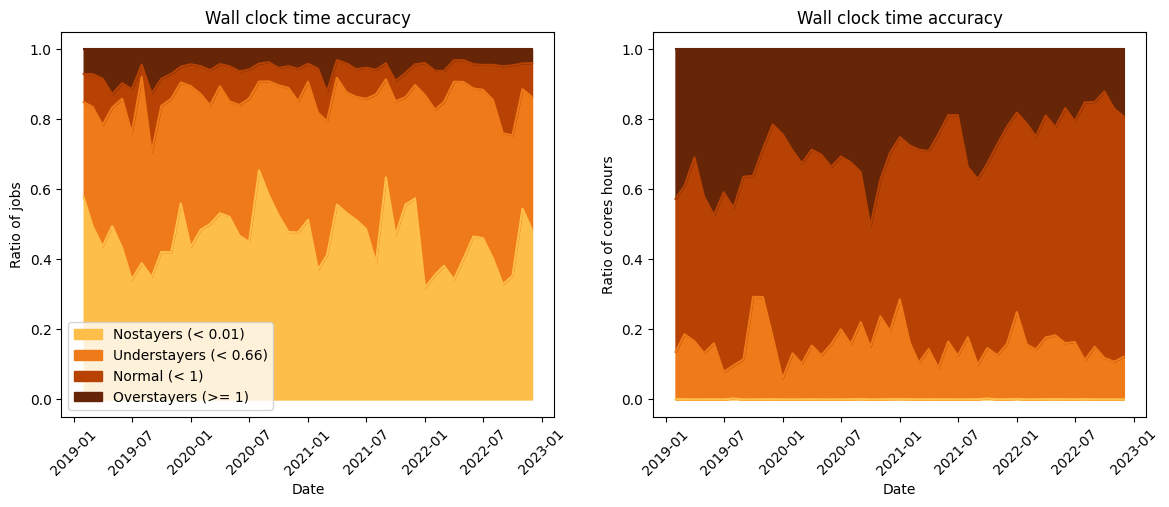
A positive piece of information is that the users seem to be more aware with the time of the importance of the time limit of the job. Indeed, we can observe that the percentage of cores hours of the jobs well calibrated increase as a function of the date.
Takeaways
We presented here an analysis of the supercomputer Kraken with seed a tool developed at CERFACS. Seed aims to analyse various characteristics of the supercomputer workload such as the frequentation, allocation and occupation, as well as the dimensions of the jobs and the waiting time.
In order to reduce the waiting time, a first approach is to raise awareness among the supercomputer users of the impact of the time limit of the job on the waiting time and waste of the computational resources.
In order to encourage the users to tailor their jobs adequately, we implemented in seed the possibility of plotting the top users each month:
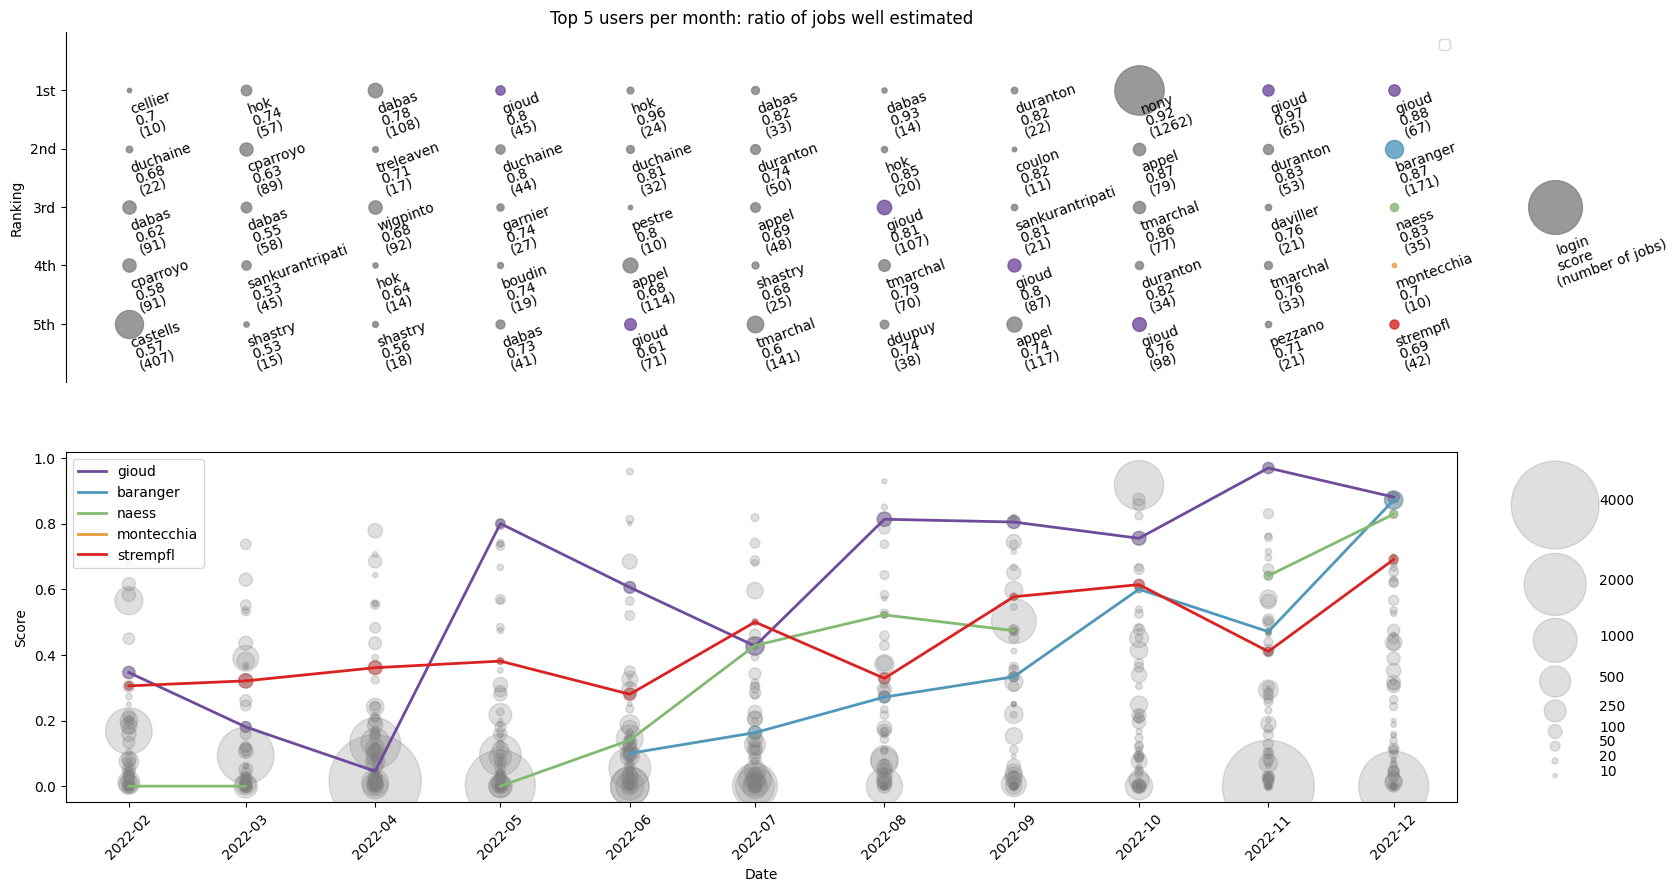
The score corresponds to the ratio between the number of jobs well estimated by the user and the number total of jobs launched by the user. This ratio is computed for each user, each month. The top figure represents the top 5 users each month, whereas the bottom figure depicts the evolution of the top 5 users of the last month. More information here again.
Acknowledgements
This work is part of center of excellence EXCELLERAT Phase 2, funded by the European Union. This work has received funding from the European High Performance Computing Joint Undertaking (JU) and Germany, Italy, Slovenia, Spain, Sweden, and France under grant agreement No 101092621.