Benchmarks, a reproducible method to assess performance of a code
The following post is divided into two main sections.
The first section will address the reasons why benchmarks are an essential step while developping a code.
The second section is meant to be used as a quickstart to build and launch your own benchmarks using Jube.
A Jube script example is given into the Appendix as a convenient way to build your own benchmark.
The simplest benchmark
The main purpose of a benchmark is to assess the performances of a code. Most of the time, the results you obtain from the benchmark become relevant by comparing them to already existing ones.
By doing so, you are able to tell if your code is more efficient than previous versions.
Performance is usually taken as the time required to perform a particular task. However, this definition is lacking precision regarding computer science. It is absolutely necessary to rigorously define which task you want to measure and particularly the allocated ressources.
Strictly speaking, benchmark does not focus on actual results accuracy but rather the necessary time to reach those results.
Results accuracy is of course particularly important when your code deals with physics models. However, comparing the results accuracy to the time to get those results is a subsequent step that is not part of the benchmark.
Let’s say you wish to measure performances of a code you developped on your own. This code is stored into a git repository so you have easily access to several tagged version of your code.
For the sake of the example, assume the code is meant to compute the velocity field of air around an airplane wing profile.
Then you choose three tagged versions of your code that you want to compare and run them on you computer. You make sure to monitor and save the time allocated to each part of your code.
Once you have ran the three versions, you end up with some sort of table or plot on which you display the time used by each version of your code.
No matter what the results are, it will be extremely hard to grant a lot of credit to these results as you did not have the absolute certainty that your computer allocated the exact same amount of resources for each of your simulations.
Running your code into a cluster could solve this issue as the resources used to run your code are a parameter the user have to set before launching the computation. By doing so, it is rather simple to compare directly several versions of your code as you are sure they used the same amount of resources.
Scalability for HPC codes
When it comes to HPC (High Performance Computing) codes, comparing the performances at iso-resources might not prove sufficient to assess the performance of your code.
MPI code performances are known to be non-linear respective to the used resources. If you double the number of cpus, although your code will finish more rapidly, it is quite unlikely you will divide by two the time of your simulation.
A typical scalabily plot would look like the following one :

fig. 2 : hypothetical scalability plot
Each point represents a simulation launched on a cluster with an increasing number of allocated CPUs.
Abscissa bears the number of CPUs used to run the simulation. Ordinates represent the speed-up that each simulation is undergoing compared to the reference simulation with 1 CPU.
For a perfect scaling, each point should reach the curve \(y=x\). In this ideal case it would means that increasing the number of used CPUs should decrease the simulation time by the exact same factor.
However, a great number of reasons could explain why a simulation does not take profit of the entire theoritical CPUs computing capacity and never reaches a perfect scaling in practice.
The most frequent explanation for the performances to slow down beyond a particular number of CPUs is found in the time they need to communicate. When your code is built to run on several CPUs, you have to synchronize the data that each CPU outputs and make it available for all CPUs to continue their computation. This flow of data between CPUs can waste a significant amount of time.
The less the slow down of the performances is when you increase the number of CPUs, the more scalable your code is considered.
In the context of CFD code, the optimum scalability can be expressed in term of CPUs per mesh elements. Beyond this limit, the time saved by increasing the number of CPUs is no more interesting compared to the additional amount of CPUs you reserve for you simulation. It means that this additional bunch of CPUs could have been used by someone else on the cluster, more efficiently than you would do.
Reproducability and automation
From previous examples, we showed two important characteristics to run a relevant benchmark.
First, in order to compare code performances of two versions at iso-resources, you have to be absolutely sure to actualy use the same amount of resources for both runs.
Running your code on a cluster on which you can precisely choose how much resources you allocate can be of great help.
Second, as the purpose of HPC code is to run computation on a large number of CPUs, scalability has to be monitored. You can monitor the scalability of the whole computation or only some steps of the code, depending on what you are looking for.
You might guess that running a scalability benchmark for each version of your code can fairly quickly become cumbersome. Relying on a tool to produce your benchmark according to parameters that you define would definitively increase reproducibility and decrease time spent to configure each run.
Jube as a benchmark tool
A great variety of benchmark tool exists. We decided to focus on a rather simple one but yet very efficient. Jube is an open source Python package in which you define you benchmark through an XML file.
Your entire benchmark plan will be defined within this XML script. It is likely you will want to use external files within your benchmark. No worries, Jube provides a rather simple way to handle them in order to run the code you desire.
The script is intended to speed up the building process of your different run directories, launch them and finally analyse the results according to user-defined Regex.
Below are some of the features Jube provides :
- Creation of parameters that can be used within your workflow.
- Keywords substitution within user-defined templates.
- Subdivision of your workflow into relevant steps.
- Definition of regular expressions to catch application-relevant data within files generated by your runs.
- Creation of result tables based on regular expression previously defined.
Once your Jube script is written, launching your Jube workflow is as simple as running the following bash command > jube run your_jube_script.xml.
Make sure to properly download and install Jube on the machine your are working on.
This post is not intended to replace the actual Jube documentation but rather emphasize on core features and concepts the user should be aware of when using Jube. To this extent references to the official Jube documentation will be done at relevant locations, providing in-depth and up to date information. Check also the Jube glossary giving in-depth explanation about the Jube syntax.
Benchmark of a Trapped Vortex configuration

Jube Logo. Jube stands for Jülich benchmarking environment.
In order to apply the core concepts and features of Jube, we propose here to build and run the benchmark of a trapped vortex on AVBP (cerfacs CFD code) on 36, 72 and 108 cpus.
The geometry displayed below aims at representing a combustion chamber section. This case is rather light (\(\approx\) 170.000 cells) giving the advantage to run it when you are not paying strong attention to the accuracy simulation results.
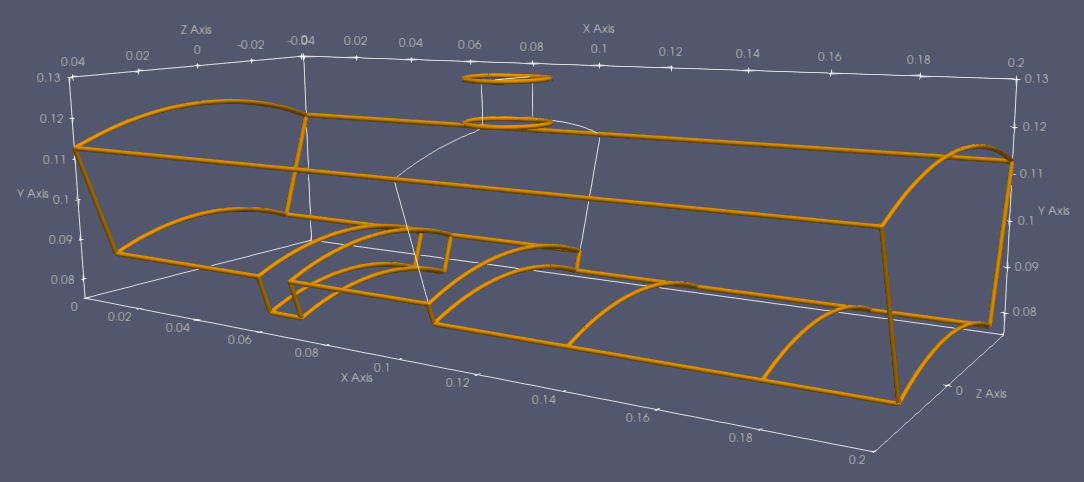
fig. 2 : Trapped vortex geometry
A basic fluid configuration is applyied to this geometry. Air is flowing inside the domain by the left boundary and the tube-like top inlet. The outlet is located on the right end side. Temperature and mass flow rate for each boundary are displayed below.
| Left inlet | Top inlet | |
|---|---|---|
| Temperature \([K]\) | \(600\) | \(1000\) |
| Mass flow rate \([\dfrac{m^3}{s}]\) | \(0.1\) | \(0.01\) |
The objective is to apply each Jube concept to the trapped vortex case.
By the end of this post, we hope you would be able to adapt the provided Jube script to your own benchmark.
Building your Jube script
The provided Jube script has been structured into section, separated by their commented names. We propose this convenient mind model to better picture how Jube works and the order in which Jube process the benchmark data.
When you give your XML script as input to Jube, several steps are performed in order to build, prepare, launch and analyse your benchmark.
First, Jube will read parameter sets you defined and build the parameter space out of it.
It will then loop over all possible combinations of the parameter space to build and prepare every run directory.
When your directories are correctly set up by Jube, the steps you defined are performed for each combination of the parameter space. In our situation, each trapped vortex case will be launched on the cluster we work on.
Finally, Jube is able to analyse the results of your simulation according to user-defined Regex and build results table out of it.
Those first explanations might be quite obscure if you are not used to Jube. To better understand, let’s see now in details how the Jube ProLb script is structured!
Configuration section
Reference to official documentation : Parameter space creation
Before writing anything within the Jube script, you will have to define your benchmark plan. This plan will entirely determine the number of parameters you will have to define.
Jube does not offer to create variable but parameters instead. Parameters can actually be a list of parameters enclosed within <parameter> markups. <parameter> markups have to be enclosed within <parameterset> markups. This last markup groups parameters together. You can define as many parameter sets as necessary and fill them with one or several parameters.
The way you define parameters is particularly important. It will tell Jube how to mix parameters together to deduce the parameter space or in other words, all the possible combinations.
Keep in mind that a single folder will be created for each parameter combination.
Let’s say you define this two parameter sets with Jube syntax :
<parameterset name="case_parameter">
    <parameter name="cpu_number">36, 72, 108</parameter>
  <parameter name="simulation_time">10.0d-03, 20.0d-03</parameter>
</parameterset>
Jube will deduce 6 possible combinations out of them :
- (36, 10.0d-03)
- (72, 10.0d-03)
- (108, 10.0d-03)
- (36, 20.0d-03)
- (72, 20.0d-03)
- (108, 20.0d-03)
Jube has mixed the parameters in this way because of the comma separating each parameters : ,.
Jube is building every unique combination looping on each <parameter> markup, taking one parameters from each <parameter> markup for every combination.
It means that the number of element within each combination will always be the same, and equal to the number of defined <parameter> markups.
If we add 144 to the “cpu_number” parameter, Jube would deduce 8 possible combinations instead of 6.
Jube has a special expression for this lists of combinations : the parameter space.
The number of all possible combinations can be found by multiplying the number of parameters for each <parameter> markups. In our first example, \(2*3=6\) combinations.
For each combination of the parameter space Jube will create and associate a unique run in your benchmark. Here, it means that 6 cases will be launched. Each one holding their own set of parameters.
The above example shows the combination of two parameter lists. However, Jube is able to handle multiple ones, applying the same combination rule. If you define 6 parameter lists of 2 parameters each you will end up with a total of 16 possible combinations.
You can define as many number of parameters and parameter sets you want. The parameter space will ultimately be calculated by Jube at the beginning of each step. (see the Steps section for more detail about parameter space expansion)
The number of parameters to run the trapped vortex benchmark is actually higher than only two. You can have a look at the full lisr of parameters wihtin the provided Jube script.
As soon as you define parameters, you are able to access them anywhere in the script, no matter in which parameter set your parameter lies. All you have to do is to enclose your parameter name by brackets, and add a dollar sign in front of it :
${cpu_number}- in this example it will represent the list of cpu number defined earlier.
Files and Substitute sections
Reference to official documentation : Files and Substitute
Files and Substitute blocks are both closely related.
<copy> markups allows you to specify the location of the files that you want Jube to copy in each run directory.
Here, we want to copy our job script template and the AVBP configuration files called run.params in each run directory.
<substituteset> markups allows you to define patterns that Jube should recognize and replace within the specified file.
This feature is particularly handy to generate an ad-hoc job script for each case, from a template in which patterns are defined.
Back to our trapped vortex benchmark, we will start by specifying the files we want to copy in each run directory :
<fileset name="copy_src_files">
  <copy>${src_files_path}</copy>
  <copy>${batch_template_path}</copy>
  <copy>${runparams_template_path}</copy>
</fileset>
- First
<copy>line will copy the trapped vortex source files. - Second will copy the job script template.
- Last one will copy the run.params template, which is the AVBP configuration file.
Then, one set of substitution rules is defined using the <substituteset> markup for each file used as a template.
On the first line within a <substituteset>, you have to specify the name of the file you want the rules to be applied to. You should also provide the name of the output generated file by Jube, in which keywords will be replaced by the specified values. This is done within the <iofile> markup.
Each substitution rule is defined within the <sub> markup. The source parameter represents the keyword to be replaced by the string specified into the dest parameter.
Consider the following job script template :
#!/bin/bash
#SBATCH --partition #PARTITION#
#SBATCH --job-name #JOB_NAME#
#SBATCH --time #TIME_LIMIT#
#SBATCH --nodes #NODE_NUMBER#
#SBATCH --ntasks-per-node #CLUSTER_NODE_NUMBER#
#SBATCH -o #OUTLOG#
#SBATCH -e #ERRLOG#

#MODULES_TO_SOURCE#

mpirun -np $SLURM_NPROCS #EXEC#
Each parameter enclosed within # are keywords used by the substitution rules.
Jube does not provide particular rules to define keywords. We choose here to enclose each parameter with a
#as we found it convenient.
Below are the substitution rules for both the job script and the run.params templates :
<substituteset name="batch_values_substitution">
  <iofile in="job_script_template" out="${batch_job_name}"/>
  <sub source="#JOB_NAME#" dest="${case_name}"/>
  <sub source="#PARTITION#" dest="${partition}"/>
  <sub source="#NODE_NUMBER#" dest="${node_number}"/>
  <sub source="#CLUSTER_NODE_NUMBER#" dest="${cluster_cpu_per_node}"/>
  <sub source="#TIME_LIMIT#" dest="${time_limit}"/>
  <sub source="#ERRLOG#" dest="err_%j_%x.log"/>
  <sub source="#OUTLOG#" dest="out_${case_name}.log"/>
  <sub source="#MODULES_TO_SOURCE#" dest="${modules_to_source}"/>
  <sub source="#EXEC#" dest="${avbp_exec}"/>
</substituteset>
<substituteset name="run_params_substitution">
  <iofile in="run.params_template" out="run.params"/>
  <sub source="#SIMU_TIME#" dest="${simulation_time}"/>
</substituteset>
Notice how we use parameters defined within the configuration section to replace keywords found by Jube.
When the substitute step begins, Jube will loop over each combination of the parameter space. Each source parameter will be replace by their dest values. As each combination of the parameter space is unique, each batch script and run.params will be too.
Keep in mind that the actual substitution process does not happen during this substitution section. Substitution will be called later on when Jube reaches the Step section.
Steps section
Reference to official documentation : Step dependencies
We have now reached the section in which steps are declared. You can define any number of steps you desire. They will be executed in the same order you define them. Each step is simply created with the <step> markup.
No matter how many steps you define, they will mainly be composed of the following Jube markups :
<use>tells Jube from which parameter sets the parameter space should be created. They are also used to run file copy and keywords substitution.<do>encloses Bash/Unix command you want to run.
Before reaching the Steps section, not a single run directory have been created by Jube. This is because run directories are build once the parameter space has been expanded by Jube. As it can be different for each step, Jube will create the relevant directories after you specify the parameter set to use within each step.
To build the parameter space of each step Jube has then to know the parameter sets from which to build them. You can select any number of parameter sets by using the <use> markup at the beginning of the step.
For example : <use>run_parameters</use> will use the parameter set called run_parameters within the step it is declared.
The parameter space will be created out of all the parameters Jube founds across the selected parameter sets. The more parameter sets you choose, the higher the number of possible combinations will be.
If you want to have a better control on the created parameter space, you will find handy to subdivide all your parameters into several parameter sets. This way, you can precisely select which parameter sets you want to mix together.
Adding multiple steps can actually bring unnecessary complexity in some cases. With this in mind, we choose to define a single step in our trapped vortex benchmark :
<step name="rundirs_generation">
  <use>src_path_parameters</use>
  <use>run_parameters</use>
  <use>copy_src_files</use>
  <use>batch_values_substitution</use>
  <use>run_params_substitution</use>
  <do>mv run.params TVX_SRC_FILE_JUBE</do>
  <do>mv ${batch_job_name} TVX_SRC_FILE_JUBE</do>
  <do>rm job_script_template</do>
  <do>rm run.params_template</do>
  <do work_dir="TVX_SRC_FILE_JUBE">${submit_cmd} $batch_job_name</do>
</step>
<use> markups :
-
First two
<use>markups selects the two parameter sets defined within the configuration section. It tells Jube to build the parameter space out of all the available parameters within those two parameter sets.
Here, as stated earlier, 6 combinations will be deduced. -
The third
<use>markup tells Jube to copy the files in each run directory as specified within the files section. -
The last two
<use>markup finally tells Jube to run the actual substitution process within the file templates previously copied.
<do> markups :
-
First two
<do>markups are moving the run.params AVBP configuration file and the job script file into a specific directory. -
Next two
<do>markups have the only purpose to clean directories by removing the file templates. -
Last
<do>markups will launch each run in their own directory.
Jube is actually looping on each command defined in each step. Once the parameter space has been expanded, Jube know how many loop it should do. This looping process explains how Jube is able to copy relevant files, proceed to substitution and launch job script in each run directory.
Result analysis
Jube provides a way to analyse output files of your simulation and display results within your shell. This is done in three steps :
-
Define Regex corresponding to information you want to catch.
-
Choose the files on which you want the regex to be applied
-
Build the results table out of the caught information by the regex.
Let’s say we want to summarise in a single table each run configuration along with their performances. We will have to read the run.params to retrieve the specified simulation time, the job script to retrieve the name and the job time limit, and finally the stdout AVBP log to retrieve the status of the job, the simulation elapsed time and the simulation time reached.
We start by defining the Regex for each of the three files using <patternset> and <pattern> markups:
<patternset name="regex_run.params">
  <pattern name="simuTime">simulation_end_time =\s+(\d+\.\d+.(\-|\+)\d+)</pattern>
</patternset>

<patternset name="regex_batch_script">
  <pattern name="runName">#SBATCH --job-name\s+(\w+)</pattern>
  <pattern name="timeLimit">#SBATCH --time\s+(\d{2}:\d{2}:\d{2})</pattern>
</patternset>

<patternset name="regex_avbp_log">
  <pattern name="runFinish">End of AVBP session</pattern>
  <pattern name="elapsedTime">AVBP\s+\:\s+(\d+\.\d{0,2})</pattern>
  <pattern name="simuTimeReached">Final dtsum\s+\:\s+(\d+\.\d+E(\+|\-)\d+)</pattern>
</patternset>
Next, we specify the files on which Regex should apply using <analyser> markup :
<analyser name="analyse_ouput">
  <use>regex_avbp_log</use>
  <use>regex_batch_script</use>
  <use>regex_run.params</use>
  <analyse step="rundirs_generation">
    <file>TVX_SRC_FILE_JUBE/out_${case_name}.log</file>
    <file>TVX_SRC_FILE_JUBE/$batch_job_name</file>
    <file>TVX_SRC_FILE_JUBE/run.params</file>
  </analyse>
</analyser>
Notice how we tell Jube to use the three Regex defined above using <use> markups. Files on which apply those regex are defined within <analyse> markup.
Finally, we tell Jube how to build the result table out of the caught information by regex within <result> markup and using <table> markups :
<result>
  <use>analyse_ouput</use>
  <table name="RUNS RESULTS" style="pretty">
    <column title="Run Name">runName</column>
    <column title="Specified Simulation Time [s]">simuTime</column>
    <column title="Run Ended?">runFinish</column>
    <column title="Elapsed Time [s]">elapsedTime</column>
    <column title="Simulation Time Reached [s]">simuTimeReached</column>
  </table>
</result>
Do not hesitate to have a look at the
<table>markup within the Jube glossary. Several options are provided to modify how your table looks and how the data are organised in it.
You have reached the end of the Jube script explanation applied to the AVBP trapped vortex simulation benchmark! When you are done writing your script, most of the work have been done.
Now is the time to launch the benchmark and analyse the results!
Launching your benchmark
Launching your benchmark with Jube is fairly easy. First, do not forget to source the virtual environment in which you installed Jube and type the following command into your shell :
> jube run your_jube_script.xml
Some information about your benchmark will be displayed into your shell and a progression bar will appear. The progression bar is associated to an increasing number which is the number of folder that Jube is creating.
A unique folder is going to be created for each combination within the parameter space, and this for each step. If your workflow is 3 steps long and the parameter space for each step is composed of 4 parameter lists, 12 folders will be created.
Once Jube has finished processing your script, you will see the Jube output folder called after the name you defined at the beginning of your Jube script into the <benchmark> markup.
Inside this folder, you will find every run directory Jube created.
Here, the parameter space of our single step from the trapped vortex benchmark contains 6 possible combinations. Jube will create the following run directories wihtin the output Jube directory :
- /000000_rundirs_generation/work/TVX_SRC_FILE_JUBE
- /000001_rundirs_generation/work/TVX_SRC_FILE_JUBE
- /000002_rundirs_generation/work/TVX_SRC_FILE_JUBE
- /000003_rundirs_generation/work/TVX_SRC_FILE_JUBE
- /000004_rundirs_generation/work/TVX_SRC_FILE_JUBE
- /000005_rundirs_generation/work/TVX_SRC_FILE_JUBE
The name of each sandbox folder is derived from the name of the step from which it is created and followed by a digit corresponding to its rank within the list of all possible combination of the parameter space.
Each run has been launched at the end of the step, meaning that from now you will be able to observe your pending jobs within the queue of the cluster :
     JOBID PARTITION    NAME     USER STA    TIME TIME_LIMI NODE PRIORITY NODELIST(REASON) START_TIME
   1206755      prod 108_TVX   rocchi PEN    0:00     15:00    3 1313 (Resources) 2023-10-05T19:18:24
   1206756      prod 108_TVX   rocchi PEN    0:00     15:00    3 1313 (Priority) 2023-10-05T19:18:24
   1206754      prod  72_TVX   rocchi PEN    0:00     15:00    2 1310 (Priority) 2023-10-05T17:38:00
   1206753      prod  72_TVX   rocchi PEN    0:00     15:00    2 1310 (Priority) 2023-10-05T17:23:54
   1206751      prod  36_TVX   rocchi PEN    0:00     30:00    1 1306 (Priority) 2023-10-05T17:53:00
   1206752      prod  36_TVX   rocchi PEN    0:00     30:00    1 1306 (Priority) 2023-10-05T17:53:00
Analysis of results
Once your jobs are done, you can launch the Jube analyse and result commands :
> jube analyse jube_out_dir
This first command is going to read the files you specified within the <analyse> markup and look for the particular regex.
Once this step is done, you can print the result table within your shell :
> jube result jube_out_dir
The table appears !
RUNS RESULTS:
| Run Name | Specified Simulation Time [s] |          Run Ended? | Elapsed Time [s] | Simulation Time Reached [s] |
|----------|-------------------------------|---------------------|------------------|-----------------------------|
|   36_TVX |                      10.0d-03 | End of AVBP session |           178.17 |              1.00005596E-02 |
|   36_TVX |                      20.0d-03 |                     |                  |                             |
|   72_TVX |                      10.0d-03 | End of AVBP session |           108.14 |              1.00005596E-02 |
|   72_TVX |                      20.0d-03 | End of AVBP session |           220.54 |              2.00004928E-02 |
|  108_TVX |                      10.0d-03 | End of AVBP session |            89.57 |              1.00005596E-02 |
|  108_TVX |                      20.0d-03 | End of AVBP session |           176.99 |              2.00004928E-02 |
Notice the blanks cells within the second line. It looks like that the corresponding run is not done yet.
You can actually run the Jube analyse and result commands before all your jobs are finished. However, some of the information might not be available for each job, leaving blank information is some cells.
Below is displayed the scalability plot of the trapped vortex running on AVBP. For the sake of the example we intentionally launched the simulation with a greater number of CPUs than the recommendation.
While increasing the ressources beyond this limit, the expected behavior of the code is to run the simulation faster, but not as fast as you would expect. Doubling the number of CPUs is no longer reducing the time of simulation by two.
You can notice how multiplying the number of CPUs by three, from 36 CPUs to 108 is not dividing the time by three. Here, the speed up is actually closer to two.

fig. 3 : trapped vortex scalability plot for 10ms simulation duration
To save resources and take the maximum profit from the available computational power of a cluster, it is essential to know what are the limit of your code.
Update your Jube post-process traitement
Jube provides a particularly handy feature if the table does not appear as you expected, or if you want to add a regex to retrieve more information and add a column to the table.
First you have to brought the relevant modifications to your Jube script. Then, without having to launch again your benchmark, launch the following command :
jube analyse -u your_jube_script.xml jube_out_dir
-ustands for--update
Run again :
> jube result jube_out_dir
… and your result table will be updated!
Lemmings and Jube : which one should you use ?
Jube is presented with the main objective of building reproducible benchmarks to ease comparison between different code versions.
However, Jube can also be used as a parametric run creator. All you have to do is to tell Jube to modify the relevant parameters within each case, leaving the same amount of resources for each run.
For example you may want to run 10 exact same trapped vortex simulations and increase for each subsequent runs the inlet air velocity by 10% from its original value. Here the objective is not to assess the performance of a particular code version but rather test multiple possibilities from a single configuration.
Regarding parametric runs, several tools already exist performing similar tasks.
At Cerfacs, COOP team have developped a Python tool named Lemmings that is able to deal with parametric workflows. Lemmings will launch several runs from the same initial configuration and brought modification to some simulation parameters.
If you desire to develop a parametric workflow, you might wonder which tool you should use? This question is definitely worth to answer before setting up your simulation campaign. Both tools are particularly handy and help you save time. However, depending on your application one of this two tools will likely be more favorable. Either by helping you gaining time, reproducibility or even results readability.
You will find below a summary of the main strenghts and drawbacks of both tools :
Jube
Advantages
Jube proposes a straighforward method to define your benchmark or parametric runs. All you have to do is to fill the predefined XML tags in the right order to fully define your workflow.
Learning curve is less steep than for Lemmings. It is easier to create your benchmark with Jube.
Drawbacks
Jube script is written in XML. Although python code can be injected into XML tags, it shows rather difficult to build complex benchmarks.
Jube is subject to predefined XML tags such as for files declaration, keywords substitution within templates, steps declaration and result tables. Jube is highly effective while staying within those bounds, making it difficult to do something more elaborated.
Lemmings
Advantages
Lemmings is entirely written in Python, then it is more convenient than Jube to build complex workflows.
Lemmings is much more flexible than Jube as it does not provide a set of steps to use in a particular order. You are free to design sophisticated steps in the order you want.
Drawbacks
Lemmings does not provide any list of steps to follow. The user has to code them.
Learning curve is steeper than for Jube. If you need to rapidly produce results, it might be longer than if Jube was used.
Rather than demonstrating that a tool is instrisically better than the other, the above comparision highlights an interesting behavior. Drawbacks of one tool prove to be solved by the features of the other, and conversely. They appear to be complementary, covering the needs and competency of a broad range of developers and scientists.
Depending of your programmation skills, the language you are more confortable with or the time you are willing to spent for your application, we hope the above comparison will help you find the most suited tool.
Appendix
The following script is provided as an example to write your own benchmark with Jube :
  <?xml version="1.0" encoding="UTF-8"?>
  <jube>
    <benchmark name="TVX_BENCHMARK" outpath="out_dir_jube_up_to_108cpus">

      <comment>
      This Jube script has been specifically developped ro run a benchmark on the light trapped vortex configuration.
      </comment>

    <!-- CONFIGURATION -->
      <parameterset name="src_path_parameters">
        <parameter name="src_files_path">/scratch/coop/rocchi/COOP_ACTIVITIES/SCALABLE/JUBE/BLOG_POST/TVX_SRC_FILE_JUBE</parameter>
        <parameter name="job_script_template_path">/scratch/coop/rocchi/COOP_ACTIVITIES/SCALABLE/JUBE/BLOG_POST/job_script_template</parameter>
        <parameter name="runparams_template_path">/scratch/coop/rocchi/COOP_ACTIVITIES/SCALABLE/JUBE/BLOG_POST/run.params_template</parameter>
      </parameterset>

      <parameterset name="run_parameters">
        <parameter name="cpu_number">36, 72, 108</parameter>
        <parameter name="cluster_cpu_per_node">36</parameter>
        <parameter name="node_number" mode="python" type="int">int($cpu_number/$cluster_cpu_per_node)</parameter>
        <parameter name="simulation_time">10.0d-03, 20.0d-03</parameter>
        <parameter name="time_limit" mode="python">{36:"00:30:00", 72:"00:15:00", 108:"00:15:00"}.get(${cpu_number}, "ERROR")</parameter>
        <parameter name="case_name">${cpu_number}_TVX</parameter>
        <parameter name="modules_to_source">module purge;module load avbp</parameter>
        <parameter name="avbp_exec">/scratch/coop/rocchi/CODE_DE_CALCUL/avbp/HOST/KRAKEN/BIN/AVBP_V7_dev.KRAKEN</parameter>
        <parameter name="submit_cmd">sbatch</parameter>
        <parameter name="partition">prod</parameter>
        <parameter name="batch_job_name">job_${case_name}.sh</parameter>
      </parameterset>

    <!-- FILES -->
      <fileset name="copy_src_files">
        <copy>${src_files_path}</copy>
        <copy>${job_script_template_path}</copy>
        <copy>${runparams_template_path}</copy>
      </fileset>

    <!-- SUBSTITUTE -->
      <substituteset name="batch_values_substitution">
        <iofile in="job_script_template" out="${batch_job_name}"/>
        <sub source="#JOB_NAME#" dest="${case_name}"/>
        <sub source="#PARTITION#" dest="${partition}"/>
        <sub source="#NODE_NUMBER#" dest="${node_number}"/>
        <sub source="#CLUSTER_NODE_NUMBER#" dest="${cluster_cpu_per_node}"/>
        <sub source="#TIME_LIMIT#" dest="${time_limit}"/>
        <sub source="#ERRLOG#" dest="err_%j_%x.log"/>
        <sub source="#OUTLOG#" dest="out_${case_name}.log"/>
        <sub source="#MODULES_TO_SOURCE#" dest="${modules_to_source}"/>
        <sub source="#EXEC#" dest="${avbp_exec}"/>
      </substituteset>

      <substituteset name="run_params_substitution">
        <iofile in="run.params_template" out="run.params"/>
        <sub source="#SIMU_TIME#" dest="${simulation_time}"/>
      </substituteset>

    <!-- STEPS -->
      <step name="rundirs_generation">
        <use>src_path_parameters</use>
        <use>run_parameters</use>
        <use>copy_src_files</use>
        <use>batch_values_substitution</use>
        <use>run_params_substitution</use>
        <do>mv run.params TVX_SRC_FILE_JUBE</do>
        <do>mv ${batch_job_name} TVX_SRC_FILE_JUBE</do>
        <do>rm job_script_template</do>
        <do>rm run.params_template</do>
        <do work_dir="TVX_SRC_FILE_JUBE">${submit_cmd} $batch_job_name</do>
      </step>

    <!-- REGEX PATTERN -->
      <patternset name="regex_run.params">
        <pattern name="simuTime">simulation_end_time =\s+(\d+\.\d+.(\-|\+)\d+)</pattern>
      </patternset>

      <patternset name="regex_batch_script">
        <pattern name="runName">#SBATCH --job-name\s+(\w+)</pattern>
        <pattern name="timeLimit">#SBATCH --time\s+(\d{2}:\d{2}:\d{2})</pattern>
      </patternset>

      <patternset name="regex_avbp_log">
        <pattern name="runFinish">End of AVBP session</pattern>
        <pattern name="elapsedTime">AVBP\s+\:\s+(\d+\.\d{0,2})</pattern>
        <pattern name="simuTimeReached">Final dtsum\s+\:\s+(\d+\.\d+E(\+|\-)\d+)</pattern>
      </patternset>

    <!-- ANALYSE -->
      <analyser name="analyse_ouput">
        <use>regex_avbp_log</use>
        <use>regex_batch_script</use>
        <use>regex_run.params</use>
        <analyse step="rundirs_generation">
          <file>TVX_SRC_FILE_JUBE/out_${case_name}.log</file>
          <file>TVX_SRC_FILE_JUBE/$batch_job_name</file>
          <file>TVX_SRC_FILE_JUBE/run.params</file>
        </analyse>
      </analyser>

    <!-- RESULT TABLE -->
      <result>
        <use>analyse_ouput</use>
        <table name="RUNS RESULTS" style="pretty">
          <column title="Run Name">runName</column>
          <column title="Specified Simulation Time [s]">simuTime</column>
          <column title="Run Ended?">runFinish</column>
          <column title="Elapsed Time [s]">elapsedTime</column>
          <column title="Simulation Time Reached [s]">simuTimeReached</column>
        </table>
      </result>
    </benchmark>
  </jube>