
One important mission of COOP falls under the broad term Computer Science and Engineering, or CSE. To get a feel for what we do, we ask for candidates to play with a sample of Python code that represents many of the topics that are important to us. Specifically, the task is to edit the code so that:
- It can be called from an other module
- It is “clean”, i.e. follows coding standards
- It gains some flexibility and functionality
If you’ve been asked to perform this task and ended up here, please read the instructions below, and send your results to the person you’ve been in contact with. Note that if you are comfortable with Python, the full test should take less than an hour. If not, tentative ETAs are given for each task.
The initial code
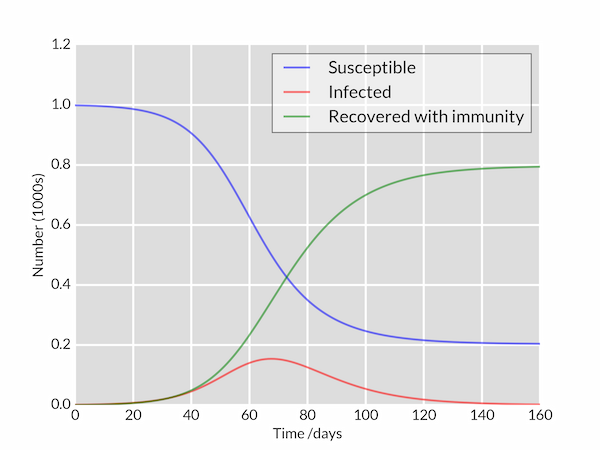
We start from a python script solving the equations of a SIR epidemiological model, found in this blog article.
import numpy as np
from scipy.integrate import odeint
import matplotlib.pyplot as plt

# Total population, N.
N = 1000
# Initial number of infected and recovered individuals, I0 and R0.
I0, R0 = 1, 0
# Everyone else, S0, is susceptible to infection initially.
S0 = N - I0 - R0
# Contact rate, beta, and mean recovery rate, gamma, (in 1/days).
beta, gamma = 0.2, 1./10
# A grid of time points (in days)
t = np.linspace(0, 160, 160)

# The SIR model differential equations.
def deriv(y, t, N, beta, gamma):
    S, I, R = y
    dSdt = -beta * S * I / N
    dIdt = beta * S * I / N - gamma * I
    dRdt = gamma * I
    return dSdt, dIdt, dRdt

# Initial conditions vector
y0 = S0, I0, R0
# Integrate the SIR equations over the time grid, t.
ret = odeint(deriv, y0, t, args=(N, beta, gamma))
S, I, R = ret.T

# Plot the data on three separate curves for S(t), I(t) and R(t)
fig = plt.figure(facecolor='w')
ax = fig.add_subplot(111, facecolor='#dddddd', axisbelow=True)
ax.plot(t, S/1000, 'b', alpha=0.5, lw=2, label='Susceptible')
ax.plot(t, I/1000, 'r', alpha=0.5, lw=2, label='Infected')
ax.plot(t, R/1000, 'g', alpha=0.5, lw=2, label='Recovered with immunity')
ax.set_xlabel('Time /days')
ax.set_ylabel('Number (1000s)')
ax.set_ylim(0,1.2)
ax.yaxis.set_tick_params(length=0)
ax.xaxis.set_tick_params(length=0)
ax.grid(b=True, which='major', c='w', lw=2, ls='-')
legend = ax.legend()
legend.get_frame().set_alpha(0.5)
for spine in ('top', 'right', 'bottom', 'left'):
    ax.spines[spine].set_visible(False)
plt.show()
This outputs the following graph:
1. Make it callable from another module
ETA: 10 - 20 min
Paste the code in a file sir_model.py and create a caller code test.py in
the same folder with the following lines:
from sir_model import sir, epidemic_plot

result = sir(days=160, population=1000, infected=1, contact_rate=0.2, infection_rate=0.1)
epidemic_plot(result)
Edit sir_model.py to make test.py work. Just use the fact that these
files are in the same folder, no $PYTHON_PATH or setup.py work needed here.
2. Clean the code
ETA: 30 min - 1h
Readability counts for good code mainteance! Please tidy this code up so that it becomes easy for maintainers to read in the future, but keep the exact same functionalities.
We like to stick to Python standards for code quality, not for each dev to decide what “clean” should look like. The bible of Python style is PEP8, buy you can get some help from Pylint, if you wish. If you don’t know about Pylint, you can check it out online, or start with our blog post on the
3. Add a functionality
ETA: 1 - 2 hours
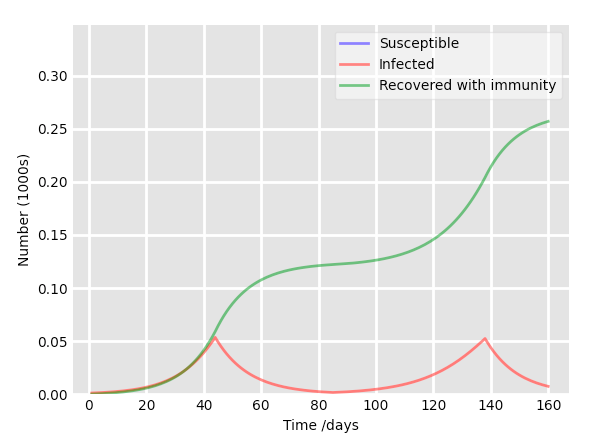
Upgrade the code to add an optional “lockdown mode”, with a choice of lockdown length in days. It should, for example, allow to set a lockdown period of 40 days each time the relative proportion of infected people reaches 5%. During the lockdown, the contact rate is decreased tenfold.
The API must keep the possibility to NOT include a quarantine mode in the simulation. The result should look like this:
And that’s a wrap!
Don’t forget to send your code to your COOP contact.