This is the part 1 of a step-by-step training on scientific programming with python. The target audience is first-years in engineering schools. There is no pre-requisite skill.
This training is usually done in groups with a trainer. However you can probably use most of this material for self teaching.
What is “programming”?
The actual definition is the process of preparing an instructional program for a device (such as a computer) (Merriam-Webster).
During these lessons, we will often use the analogy of a cooking recipe:
- If you follow the recipe, you will get the result right
- A recipe (e.g. a pie) can delegate some parts to another recipe (e.g. the dough).
A striking aspect of recipes/programs is that many versions can reach the same result:
- For a similar result, some recipes are faster.
- For a similar result, some recipes are easier.
- For a similar result, some recipes are more easily read.
On this last point, Readability matters a lot. Your hand-written recipes folder is fine for you, but if you want to share it to friends, you probably rewrite it. If you want to sell it, you have to comply to the cookbooks standards (Glossary, Ingredients, Pictures).
If you look at the history of programming projects, developers reshape, prune, graft, rewrite many times the same code, like bees hovering over the same bush. If you write a code, even if you are a beginner, especially if you are a beginner, try your best to make it readable.
In a nutshell, programming is more a craft than an art or a science. Like any craft, you cannot learn without doing…
My first program
You will try now to run you first python program.
Use an editor to create a file babysteps.py with the following content
print("Hello world")
Ah yes, you need and editor…
Pick your editor
You will spend a lot of time in the editor from now on, so invest a bit of time into choosing and lerning more about your editor. Many are possibles
viis the “no-mouse keyboard-only” editor available on all Unix platforms. vi extensions are impressive. For short editions, it is fine foreveryone. For long project, only geeks will stick tovi.- There are many Unix editors such as gedit (Gnome), kwrite (KDE), emacs (GNU).
- Then there are the Indegrated Development Environement (IDE). You can try Komodo, Sublime, PyCharm, VisualStudio.
Editors are also a matter of personal taste. Beware, there has always been an editor war, and pushing your champion can sent you into endless discussions, in other words pure time loss. For beginners, the author would maybe suggest Sublime, because it feels (IMHO) like a normal text editor at first.
Run the program with the python interpreter
We will use the basic interpreter of python. Try out the following command:
>python
Python 3.8.5 (default, Jul 21 2020, 10:42:08)
[Clang 11.0.0 (clang-1100.0.33.17)] on darwin
Type "help", "copyright", "credits" or "license" for more information.
If you get only a Python version 2.X, try:
>python3
Python 3.8.5 (default, Jul 21 2020, 10:42:08)
[Clang 11.0.0 (clang-1100.0.33.17)] on darwin
Type "help", "copyright", "credits" or "license" for more information.
You have no python installed. O-kay, do not panic!. Install python using the official python ressource.
On most Unix installations, you can simply try:
apt-get install python
If you did manage to launch python. Use quit() to exit the session.
>python
Python 3.8.5 (default, Jul 21 2020, 10:42:08)
[Clang 11.0.0 (clang-1100.0.33.17)] on darwin
Type "help", "copyright", "credits" or "license" for more information.
>>> quit()
>
Now run your program this way:
>python babysteps.py
Hello world
>
a more interesting program:
We will try a more interesting program with printing, conditions, loops:
print("hello world")

x = 1
if x==1:
    print("x is ", x)

y=1
s=0
while y < 100:
    s = s + y
    y = y + 1
print("somme =", s)
print("Fin")
This is now more looking like your usual programming routine. You can play a while with these lines and see what happen. Feel free to change the indentations, spacings, order, etc… and see what the Python interpreter makes of these changes.
indentations
Indentations are essential to python, as they defin blocks. You can read more in this indentation tutorial. You need to remember only this:
- indentations are part of the code
- one indent is 4 spaces. Do NOT try your luck with something else.
- do not use tabulation in the indents, they do not work and it is hard to spot afterward.
- if your editor can indent the code, make sure you switch it to “prefer spaces over tabulations / 4 spaces”. This is often at the lower right of your editor window.
A real-life scientific programming example
Finding the correct model
Suppose you need, for your business, a model of virus contamination in a population. A small search on the web (keywords : model, epidemiology) will probably lead you to the Compartmental models in epidemiology. The simplest one is apparently the S.I.R. model.
Fetch the model
Now we search an implementation of the S.I.R. model in python (keywords : model, SIR, python). We find for example this blog article including sources. The raw sources are the following:
import numpy as np
from scipy.integrate import odeint
import matplotlib.pyplot as plt

# Total population, N.
N = 1000
# Initial number of infected and recovered individuals, I0 and R0.
I0, R0 = 1, 0
# Everyone else, S0, is susceptible to infection initially.
S0 = N - I0 - R0
# Contact rate, beta, and mean recovery rate, gamma, (in 1/days).
beta, gamma = 0.2, 1./10
# A grid of time points (in days)
t = np.linspace(0, 160, 160)

# The SIR model differential equations.
def deriv(y, t, N, beta, gamma):
    S, I, R = y
    dSdt = -beta * S * I / N
    dIdt = beta * S * I / N - gamma * I
    dRdt = gamma * I
    return dSdt, dIdt, dRdt

# Initial conditions vector
y0 = S0, I0, R0
# Integrate the SIR equations over the time grid, t.
ret = odeint(deriv, y0, t, args=(N, beta, gamma))
S, I, R = ret.T

# Plot the data on three separate curves for S(t), I(t) and R(t)
fig = plt.figure(facecolor='w')
ax = fig.add_subplot(111, facecolor='#dddddd', axisbelow=True)
ax.plot(t, S/1000, 'b', alpha=0.5, lw=2, label='Susceptible')
ax.plot(t, I/1000, 'r', alpha=0.5, lw=2, label='Infected')
ax.plot(t, R/1000, 'g', alpha=0.5, lw=2, label='Recovered with immunity')
ax.set_xlabel('Time /days')
ax.set_ylabel('Number (1000s)')
ax.set_ylim(0,1.2)
ax.yaxis.set_tick_params(length=0)
ax.xaxis.set_tick_params(length=0)
ax.grid(b=True, which='major', c='w', lw=2, ls='-')
legend = ax.legend()
legend.get_frame().set_alpha(0.5)
for spine in ('top', 'right', 'bottom', 'left'):
    ax.spines[spine].set_visible(False)
plt.show()
We copy/paste it into a file named sir_0_0_0.py, then we try to launch it:
>python sir_0_0_0.py
It should give you the following result:
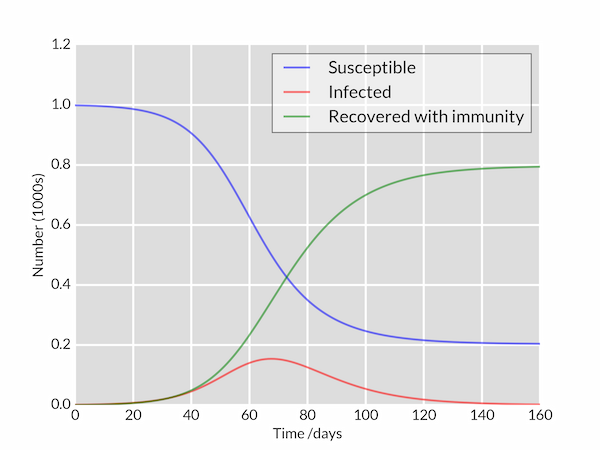
If you encounter an error of the type
ModuleNotFoundError, scipy module is not available
Simply install the missing module with
> pip install scipy
then retry…
You may need to read the next section “Environment and Packages” if you encounter problems at this point.
Rewrite the code to make it readable
The sources codes you will find on the internet are of heterogeneous quality, to say the least. In this step, we will rewrite without changing the piece of code.
In python, the tool pylint gives a score on readability. Install it and try it:
> pip install pylint
> pylint sir_0_0.py
************* Module sir_0_0_0
sir_0_0.py:12:24: C0303: Trailing whitespace (trailing-whitespace)
sir_0_0.py:38:13: C0326: Exactly one space required after comma
ax.set_ylim(0,1.2)
             ^ (bad-whitespace)
sir_0_0.py:46:0: C0304: Final newline missing (missing-final-newline)
sir_0_0.py:1:0: C0114: Missing module docstring (missing-module-docstring)
sir_0_0.py:17:13: W0621: Redefining name 't' from outer scope (line 14) (redefined-outer-name)
sir_0_0.py:17:16: W0621: Redefining name 'N' from outer scope (line 6) (redefined-outer-name)
sir_0_0.py:17:19: W0621: Redefining name 'beta' from outer scope (line 12) (redefined-outer-name)
sir_0_0.py:17:25: W0621: Redefining name 'gamma' from outer scope (line 12) (redefined-outer-name)
sir_0_0.py:18:4: W0621: Redefining name 'S' from outer scope (line 28) (redefined-outer-name)
sir_0_0.py:18:7: W0621: Redefining name 'I' from outer scope (line 28) (redefined-outer-name)
sir_0_0.py:18:10: W0621: Redefining name 'R' from outer scope (line 28) (redefined-outer-name)
sir_0_0.py:17:0: C0103: Argument name "y" doesn't conform to snake_case naming style (invalid-name)
sir_0_0.py:17:0: C0103: Argument name "t" doesn't conform to snake_case naming style (invalid-name)
sir_0_0.py:17:0: C0103: Argument name "N" doesn't conform to snake_case naming style (invalid-name)
sir_0_0.py:17:0: C0116: Missing function or method docstring (missing-function-docstring)
sir_0_0.py:18:4: C0103: Variable name "S" doesn't conform to snake_case naming style (invalid-name)
sir_0_0.py:18:7: C0103: Variable name "I" doesn't conform to snake_case naming style (invalid-name)
sir_0_0.py:18:10: C0103: Variable name "R" doesn't conform to snake_case naming style (invalid-name)
sir_0_0.py:19:4: C0103: Variable name "dSdt" doesn't conform to snake_case naming style (invalid-name)
sir_0_0.py:20:4: C0103: Variable name "dIdt" doesn't conform to snake_case naming style (invalid-name)
sir_0_0.py:21:4: C0103: Variable name "dRdt" doesn't conform to snake_case naming style (invalid-name)
sir_0_0.py:17:13: W0613: Unused argument 't' (unused-argument)
sir_0_0.py:18:10: W0612: Unused variable 'R' (unused-variable)

-----------------------------------
Your code has been rated at 3.03/10
Readability is fully defined by the PEP008 standard in python. Do not mind too much about it, tools will tell you what to do. Simply put, having a score of 3/10 means this code is a bit hard to read.
Now we rewrite the code in a more edible form. Make a copy en edit this copy with your preferred text editor.
"""Module to apply the SIR epidemiology model to a population.

Found at : https://scipython.com/book/chapter-8-scipy/additional-examples/the-sir-epidemic-model/

"""

import numpy as np
from scipy.integrate import odeint
import matplotlib.pyplot as plt


def sir_diff_eq(state, time, population, beta, gamma):
    """The differential equations of SIR for an instant

        state: list of suceptible, infected, recovered
        time : time (days)
        population: integer total population
        beta : [0,1] contact rate
        gamma : [0,1] recovery rate

        return : scp_dt, dinf_dt, drec_dt
        """
    suceptible, infected, recovered = state
    dscp_dt = -beta * suceptible * infected / population
    dinf_dt = beta * suceptible * infected / population - gamma * infected
    drec_dt = gamma * infected
    return dscp_dt, dinf_dt, drec_dt


def plot_pandemy(time, suceptible, infected, recovered):
    """Plot the data on three separate curves for S(t), I(t) and R(t)

    time: list of times shape (DAYS)
    suceptible: list of suceptible shape (DAYS) in range [0,1]
    infected: list of infected shape (DAYS) in range [0,1]
    recovered: list of recovered shape (DAYS) in range [0,1]
    """
    fig = plt.figure(facecolor="w")
    ax = fig.add_subplot(111, facecolor="#dddddd", axisbelow=True)
    ax.plot(time, suceptible, "b", alpha=0.5, lw=2, label="Susceptible")
    ax.plot(time, infected, "r", alpha=0.5, lw=2, label="Infected")
    ax.plot(
        time, recovered, "g", alpha=0.5, lw=2, label="Recovered with immunity",
    )
    ax.set_xlabel("Time /days")
    ax.set_ylabel("Number (1000s)")
    ax.set_ylim(0, 1.2)
    ax.yaxis.set_tick_params(length=0)
    ax.xaxis.set_tick_params(length=0)
    ax.grid(b=True, which="major", c="w", lw=2, ls="-")
    legend = ax.legend()
    legend.get_frame().set_alpha(0.5)
    for spine in ("top", "right", "bottom", "left"):
        ax.spines[spine].set_visible(False)
    plt.show()


def sir(
    population, init_infected, init_recovered, contact_rate, recovery_rate, duration
):
    """The SIR model computation on time.

    population: integer, the total population
    init_infected: integer, the initial number of infected people
    init_recovered: integer, the initial number of infected people

    contact_rate: float [0,1] the contamination rate (beta)
    recovery_rate: float [0,1] the recovery rate (gamma)
    """

    # Everyone else, S0, is susceptible to infection initially.
    init_suceptible = population - init_infected - init_recovered
    # A grid of time points (in days)
    time = np.linspace(0, duration, duration)
    # Initial conditions vector
    state_0 = init_suceptible, init_infected, init_recovered

    # Integrate the SIR equations over the time grid, t.
    ret = odeint(
        sir_diff_eq, state_0, time, args=(population, contact_rate, recovery_rate)
    )
    suceptible, infected, recovered = ret.T

    # plot
    plot_pandemy(time, suceptible/population, infected/population, recovered/population)


sir(
    population=1000,
    init_infected=1,
    init_recovered=0,
    contact_rate=0.2,
    recovery_rate=0.1,
    duration=160,
)
In this second version, the code is longer.
- many docstrings have been added. At the beginning , to describe the module , then at each function, describing what are the variables, both in types and meaning.
- The
derivfunction has been renamed assir_diff_eqwhich is a bit more meaningful. - all 1char variables have been replaced by human readable variables.
- the plotting is now a separate function
plot_pandemy. - The resolution is also a separate function
sir.
Note: we used blackto take care of all the spacings and indentation stuff:
> pip install black
> black sir_0_0_1.py
reformatted sir_0_0_1.py
All done! ✨ 🍰 ✨
1 file reformatted.
The pylint score is about 8.53 now. What is interesting now is the following. The sir_diff_eq is rather easy to read, and the plot_pandemy is not related to our problem. We can only focus on the function sir. This last function is only 6 statements long.
The real difficulty is the resolution done by odeint(), which comes from scipy. Let’s search documentation about it (keywords: scipy, odeint). We land on the scipy documentation resource where you find an extensive explanation of the magic.
Now this new code will should easier to handle if you want to change the resolution, the case studied, or the equations themselves.
Simulate a quarantine
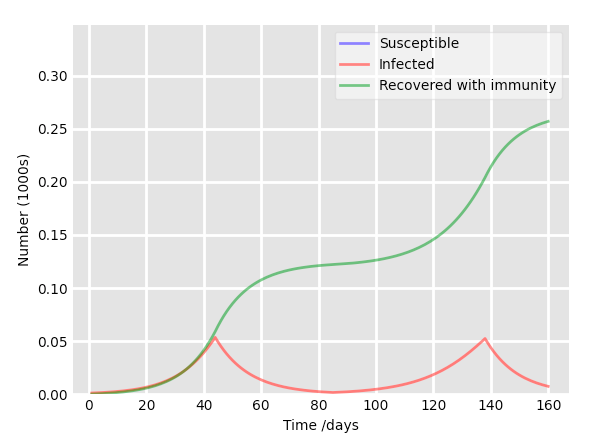
No we can go further. You need to change this code to represent, not a small flu at school, but a real pandemic with several waves of contaminations. It is time to rack your brains folks!
Try to take into account a social distancing period of 40 days (contact rate = 0.02) each time the relative proportion of infected people reaches 5% of the population. The result should look like:
Environment and Packages
During the previous example, we had to rely external Python packages : numpy, scipy, matplotlib. One of the strongest points of Python is the ease to include external packages to you execution environment. You should probably have a look at the Python package Index pypi.org. All these packages are for free, and you can find almost anything.
Example on epidemics
Try for example the keywords sir, model, epidemiology and see how many teams provided their tools to the community. These guys are actually competing for the most attractive and easy to use solution, through eye-catching readme and extensive documentation (epipack, covid-seird). If after this you are still thinking of re-writing your own SIR model from scratch, you are affected by the Not Invented Here syndrome, a common disease among programmers.
How do I get a package?
To get a package into your python3 environment, use pip. Remember simply three commands:
> pip list
Package         Version
--------------- -------
cycler          0.10.0
kiwisolver      1.3.1
matplotlib      3.3.3
numpy           1.19.4
Pillow          8.0.1
pip             20.1.1
pyparsing       2.4.7
python-dateutil 2.8.1
scipy           1.5.4
setuptools      47.1.0
six             1.15.0
… will list all the packages in your environment
> pip install numpy
… will install numpy to your current python environment
> pip uninstall numpy
… will remove numpy from your current python environment
Virtual environments
As you will install packages for each project, your python environment will grow, and you can get stuck. For example projet A need scipy 1.5.4 maximum, while project B need scipy 2.0.0 at least. (These numbers means the two versions are not equivalent).
Therefore it is good practice to keep your environment under control by creating virtual environments (venv). You can read our basics on venvs to get to the point faster.
peculiar packages
Some packages need special care. For example, Tk) is a very common library used for for graphical interface. It is not available on PyPI, you need a more Unix-like way of installation:
sudo apt-get install python3-tk
The famous plotting package matplotlib, is also asking for graphical backends that are not on PIPy. On your first use, if nothing is available, you will get this kind of error:
UserWarning: Matplotlib is currently using agg, which is a non-GUI backend, so cannot show the figure.
Simply install the Tk backend to be sure you have one. You can read more on matplotlib backends on the dedicated documentation on backends